Servers & monitoring
VictoriaMetrics Community
Open-source time-series database and monitoring backend, with a built-in query UI.
Release notes / v1.156.0
Released 2026-11-09. Snapshot from the included release data, not a live check.
## [v1.156.0](https://github.com/VictoriaMetrics/VictoriaMetrics/releases/tag/v1.156.0) Released at 2026-11-09 * FEATURE: all VictoriaMetrics [Enterprise](https://docs.victoriametrics.com/victoriametrics/enterprise/) components: run with the `-eula` command-line flag to accept [ESA](https://victoriametrics.com/legal/esa/). License keys are no longer verified. The `-license`, `-licenseFile`, `-licenseFile.reloadInterval` and `-license.forceOffline` flags are deprecated and are treated as `-eula`, so existing setups keep working. See [Running VictoriaMetrics Enterprise](https://docs.victor
Read the full release notes on GitHub ↗Available on these platforms
VMUI is a browser interface to a VictoriaMetrics server. This does not assert a native mobile client or that the database service runs on the phone.
Compatibility details and official sources
- Web - Browser interface
Official availability checked 2026-11-12. Availability is not feature parity. The recorded release and license refer to the linked source project; separate clients can differ. No install or compatibility test was run.
Before you install
Fast time-series storage that pairs with Grafana.
- What does it run on?
- A single-node server (binary, Docker or packages). This page covers the open-source single-node server, not the enterprise features or VictoriaMetrics Cloud.
- Where is my data?
- Metrics live on your server; query it with its API or point Grafana at it for dashboards.
- What will I maintain?
- The server, storage growth and retention settings. Apache-2.0 community code; enterprise and cloud are separate offerings.
Advice and funding routes source-checked November 12, 2026. Researched, not an install or restore test. Installation source ↗ · Report a correction
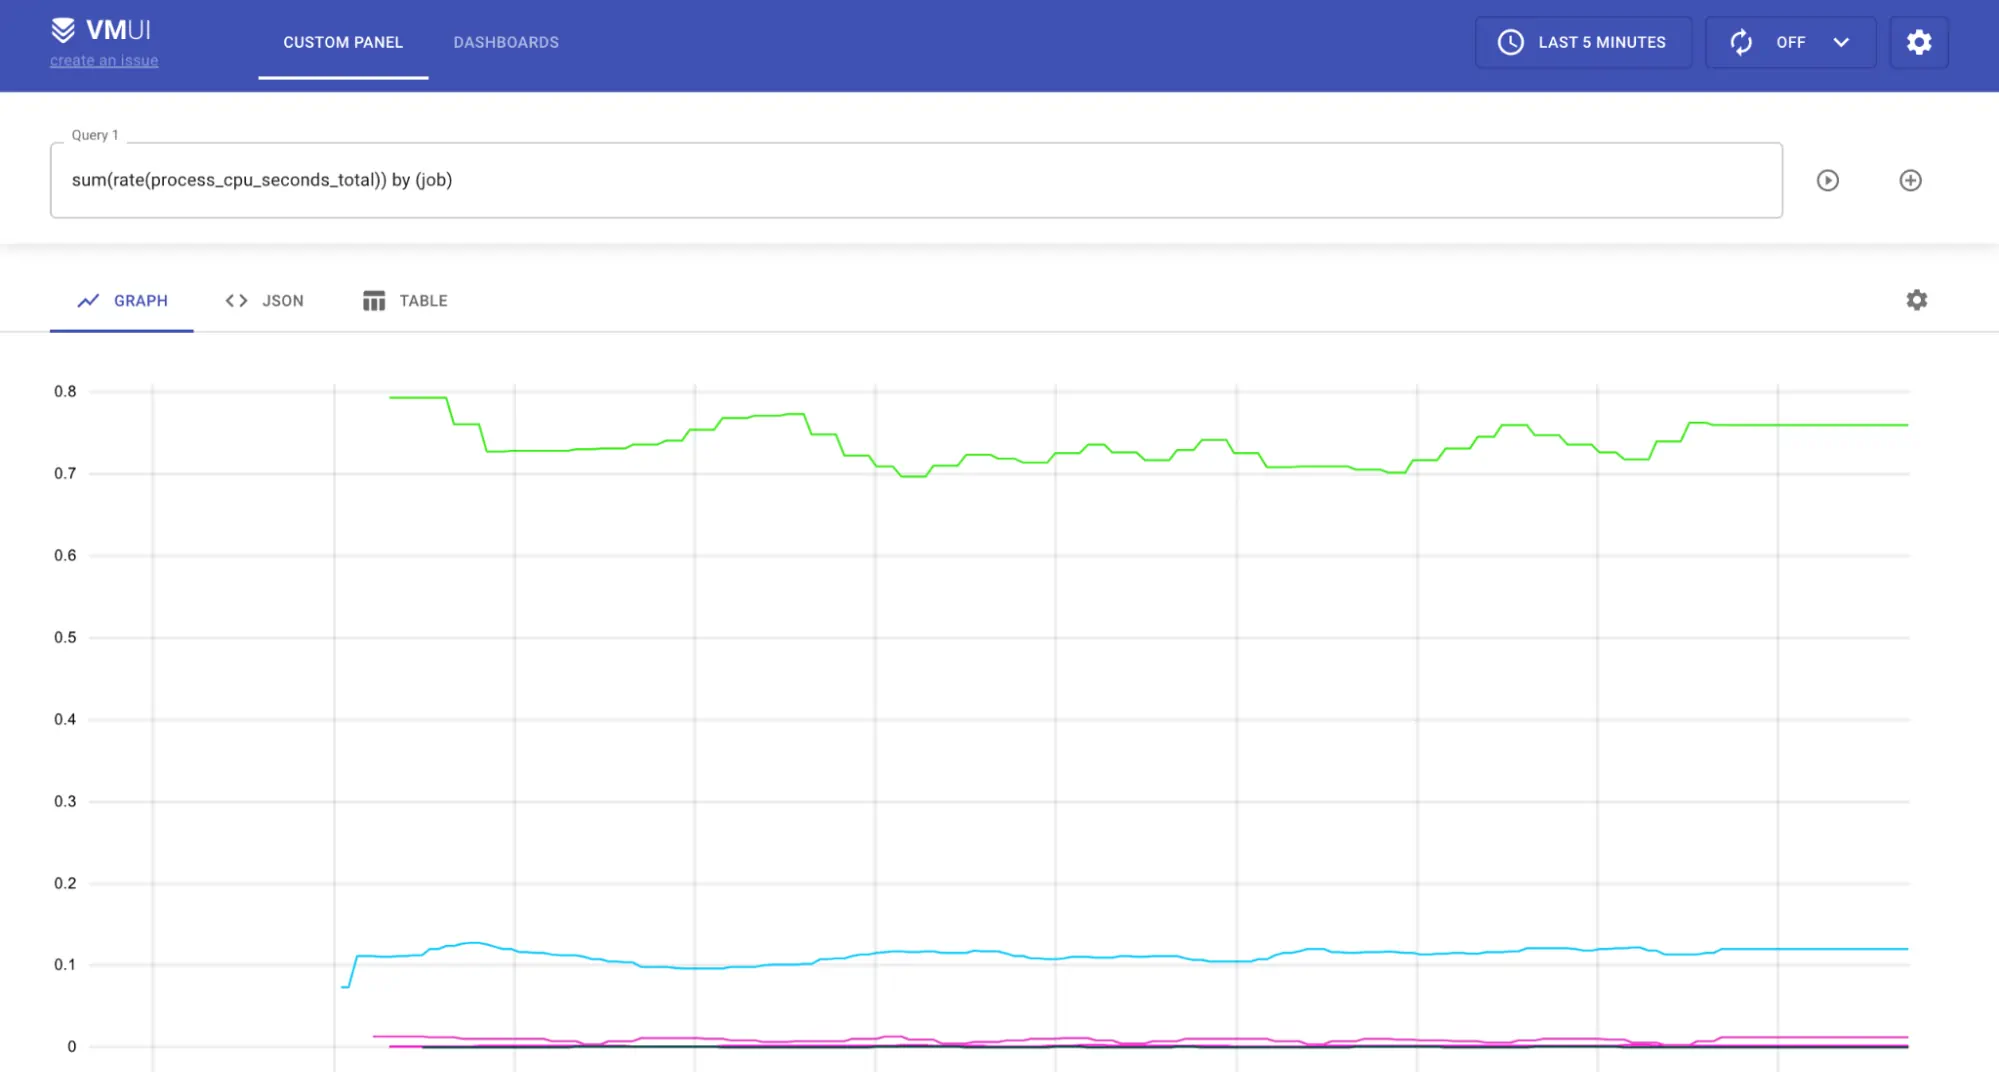

VictoriaMetrics stores and queries monitoring time series. The Community code is Apache-2.0. Enterprise features and VictoriaMetrics Cloud are separate offerings; this page covers the open-source single-node server, not a hosted subscription. It can complement Grafana rather than replace every monitoring dashboard.
Quick start
Researched against official single-server documentation and pinned nixpkgs sources on November 11, 2026. These steps have not been executed here.
Docker Compose
For a local monitoring lab, create compose.yaml:
services:
  victoriametrics:
    image: victoriametrics/victoria-metrics:v1.156.0
    command:
      - -storageDataPath=/storage
      - -selfScrapeInterval=5s
    ports:
      - "127.0.0.1:8428:8428"
    volumes:
      - vm-data:/storage
    restart: unless-stopped
volumes:
  vm-data:
Run docker compose up -d, then open http://localhost:8428/vmui/. After a few
seconds, query process_resident_memory_bytes and click Execute Query. The
self-scrape flag supplies sample server metrics; it does not discover the rest
of your network. Data persists in the volume. docker compose down stops the
lab; adding -v erases the stored data.
Linux
Download the Community single-node archive for your CPU from the project’s release page, check the published checksum, and extract it. From that directory:
./victoria-metrics-prod -storageDataPath=./vm-data -httpListenAddr=127.0.0.1:8428 -selfScrapeInterval=5sKeep the terminal running and use VMUI as above. Stop with Ctrl-C. This is a lab process, not a configured system service. The server is not authenticated by default: do not expose port 8428 publicly. Arrange access control, retention and backups before using it for real monitoring.
NixOS
services.victoriametrics = {
  enable = true;
  listenAddress = "127.0.0.1:8428";
  extraOptions = [ "-selfScrapeInterval=5s" ];
};
Apply with sudo nixos-rebuild switch, then open VMUI and try the same query.
The module manages the service and storage directory. The nixpkgs version can
differ from the recorded upstream release.
First use
Add explicit scrape targets or configure a Prometheus-compatible remote-write sender using the official guide. Check ingestion and retention before relying on the graphs. A local storage volume is not a backup. Keep write endpoints and query endpoints behind suitable authentication for multi-user deployments.
Documentation
- Single-server guide and Docker image
- Metrics and query concepts
- Community and Enterprise differences
- NixOS module source
Docker Compose · Open-source time-series database and monitoring backend, with a built-in query UI. Paste into your AI assistant. It may only be able to guide you. Review changes before running anything.
Researched, not run by the Index. Checked 2026-11-12. No AI account or connection is needed here.
Read or copy the prompt manually
Linux · Open-source time-series database and monitoring backend, with a built-in query UI. Paste into your AI assistant. It may only be able to guide you. Review changes before running anything.
Researched, not run by the Index. Checked 2026-11-12. No AI account or connection is needed here.
Read or copy the prompt manually
NixOS · Open-source time-series database and monitoring backend, with a built-in query UI. Paste into your AI assistant. It may only be able to guide you. Review changes before running anything.
Researched, not run by the Index. Checked 2026-11-12. No AI account or connection is needed here.
Read or copy the prompt manually
Tags: Infrastructure