Servers & monitoring
Scrutiny
Self-hosted S.M.A.R.T. hard-drive health monitoring with a web dashboard, collector agents and alerting.
Release notes / v0.10.0
Released 2026-11-01. Snapshot from the included release data, not a live check.
Latest GitHub release at check time.
Read the full release notes on GitHub ↗Available on these platforms
Official hardware and installation choices ↗
Collectors need device access (SYS_RAWIO, drive devices) to read S.M.A.R.T. data; remote machines report to one web server.
Compatibility details and official sources
- Linux - Self-hosted server (omnibus Docker image or hub-and-spoke collectors)
- Web - Browser dashboard
Official availability checked 2026-11-12. Availability is not feature parity. The recorded release and license refer to the linked source project; separate clients can differ. No install or compatibility test was run.
Before you install
See a dying disk before it takes data with it.
- What does it run on?
- A web dashboard (Docker or binary) plus small collector agents on machines with drives you care about. It wraps smartd/smartctl data.
- Where is my data?
- S.M.A.R.T. history, temperatures and wear data live on your Scrutiny server.
- What will I maintain?
- The dashboard, the collectors and alert settings. MIT-licensed; pairs naturally with a notification service such as Gotify.
Advice and funding routes source-checked November 12, 2026. Researched, not an install or restore test. Installation source ↗ · Report a correction
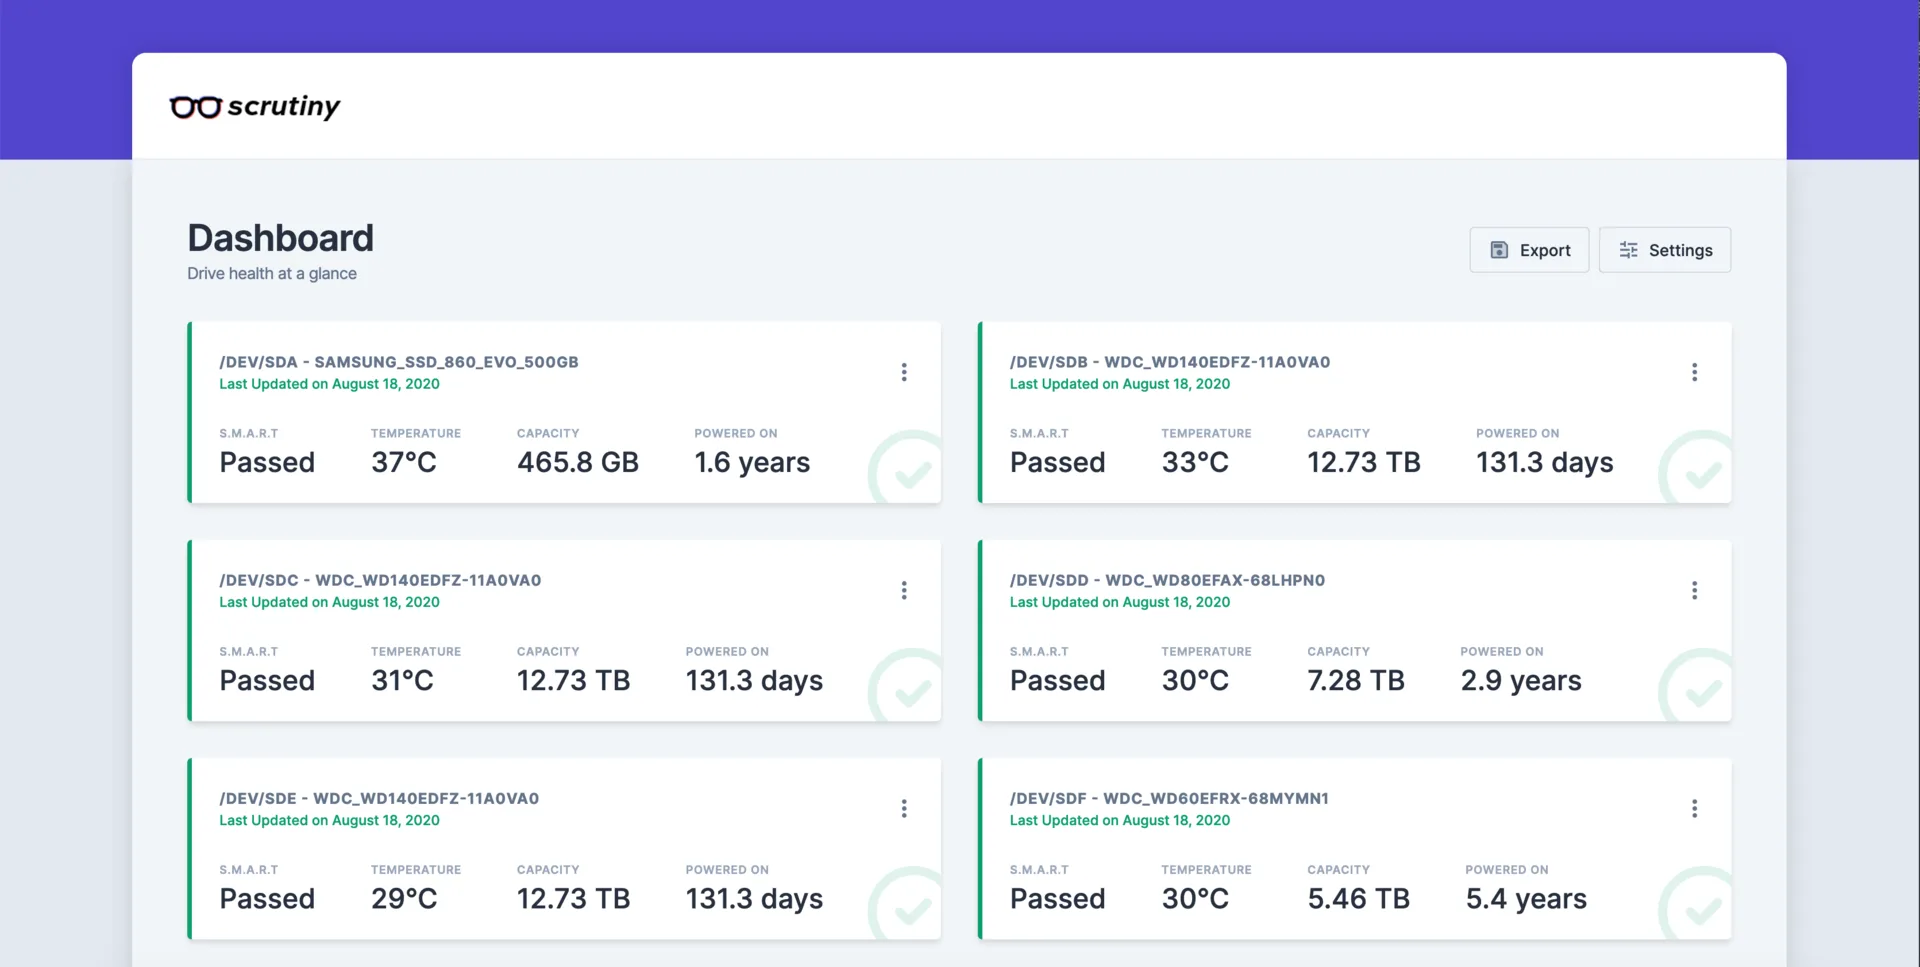

Scrutiny is an MIT-licensed web dashboard for hard-drive and SSD health. It collects S.M.A.R.T. data from your drives through small collector agents, keeps history, and surfaces failures, temperature and wear so a dying disk is visible before it takes data with it. It wraps smartd/smartctl data in a clearer interface rather than replacing the underlying tools.
The name and glasses logo belong to the project. This is an independent listing, not an official Scrutiny resource or an endorsement.
Quick start
Researched from the Scrutiny repository and documentation on November 12, 2026. We have not installed or run it.
Docker (upstream’s documented route)
The project documents an omnibus Docker image that runs the web server and a collector together:
docker run -it --rm -p 8080:8080 \
  -v /run/udev:/run/udev:ro \
  --cap-add SYS_RAWIO \
  --device=/dev/sda \
  --name scrutiny \
  ghcr.io/analogj/scrutiny:master-omnibus
Pass each drive device you want monitored, or use the documented hub-and-spoke layout where collectors on other machines report to one web server. Open the dashboard on port 8080 from a trusted network.
NixOS
services.scrutiny = {
  enable = true;
  openFirewall = false;
};
Apply with sudo nixos-rebuild switch. The module runs the web interface
and collector; check its settings for the listen port and inbound rules
before exposing it beyond localhost or a trusted LAN.
First use
Confirm every drive you expect appears on the dashboard; missing disks usually mean the collector lacks device access. Let it gather history before trusting trends, and configure notifications (the project supports several shoutrrr-style services) so alerts reach you without watching the UI.
Documentation
Docker (upstream's documented route) · Self-hosted S.M.A.R.T. hard-drive health monitoring with a web dashboard, collector agents and alerting. Paste into your AI assistant. It may only be able to guide you. Review changes before running anything.
Researched, not run by the Index. Checked 2026-11-12. No AI account or connection is needed here.
Read or copy the prompt manually
NixOS · Self-hosted S.M.A.R.T. hard-drive health monitoring with a web dashboard, collector agents and alerting. Paste into your AI assistant. It may only be able to guide you. Review changes before running anything.
Researched, not run by the Index. Checked 2026-11-12. No AI account or connection is needed here.
Read or copy the prompt manually
Tags: Monitoring