Servers & monitoring
Grafana
Dashboards and alerts for metrics, logs and traces from your own data sources.
Release notes / v13.3.1
Released 2026-11-10. Snapshot from the included release data, not a live check.
[Download page](https://grafana.com/grafana/download/13.3.1) [What's new highlights](https://grafana.com/docs/grafana/latest/whatsnew/) ### Security - Security: Fix CVE-2026-102589 - Security: Fix CVE-2026-107509 - Security: Fix CVE-2026-110992 - Security: Fix CVE-2026-111024 - Security: Fix CVE-2026-13721 - Security: Fix CVE-2026-14242 ### Features and enhancements - **DateTime:** Update moment-timezone and easy-tz for 2026 time zone changes [#136951](https://github.com/grafana/grafana/pull…
Read the full release notes on GitHub ↗Available on these platforms
Grafana dashboards run in a browser connected to a Grafana server. Server packaging and plugins have separate requirements; this does not assert a native phone client.
Compatibility details and official sources
- Web - Browser interface
Official availability checked 2026-11-12. Availability is not feature parity. The recorded release and license refer to the linked source project; separate clients can differ. No install or compatibility test was run.
Before you install
Dashboards on top of the data you already have.
- What does it run on?
- A server - Docker, packages or a NixOS module - that reads from sources such as Prometheus, Loki and InfluxDB rather than storing everything itself.
- Where is my data?
- Dashboard definitions and alerts live on your Grafana server; the underlying metrics stay in whichever database you connect.
- What will I maintain?
- The Grafana server, its data-source connections and dashboard upkeep. Dashboards survive swapping the database behind them. Grafana Labs sells cloud and enterprise offerings separately.
Advice and funding routes source-checked November 12, 2026. Researched, not an install or restore test. Installation source ↗ · Report a correction
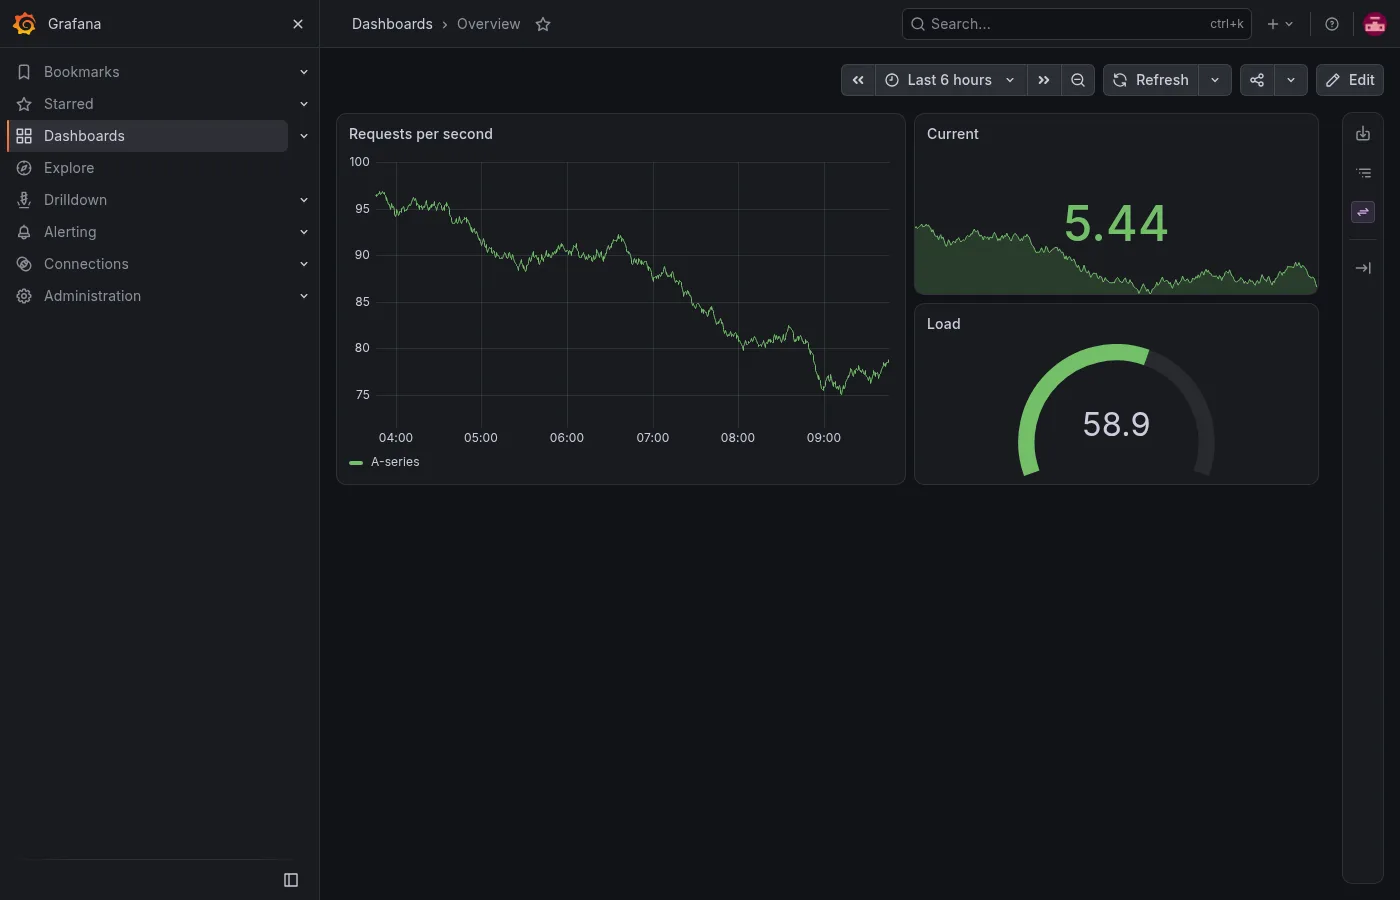
Grafana turns data from sources such as Prometheus, Loki and InfluxDB into dashboards: charts you arrange yourself, with alerts when a value crosses a line you set. It reads from wherever your data already lives, so the dashboards stay even if you swap the database behind them.
The open source edition is AGPL-3.0 and developed by Grafana Labs together with its community. There is no donation route; the company funds the work through its paid Grafana Cloud and Enterprise offerings, recorded above as a subscription rather than a donation.
Quick start
Verified against Grafana’s own documentation on November 8, 2026; we haven’t run these setups ourselves.
Docker is an upstream-supported route. The NixOS module is maintained in nixpkgs; its packaged version can differ from the recorded upstream release above. These examples keep the dashboard on localhost. For remote access, use an SSH tunnel or a reverse proxy with HTTPS, rather than opening the port directly.
Docker Compose
Save this as compose.yaml, adapted from the official Docker guide with
a localhost-only port binding:
services:
  grafana:
    image: grafana/grafana
    ports:
      - "127.0.0.1:3000:3000"
    volumes:
      - grafana-storage:/var/lib/grafana
    restart: unless-stopped

volumes:
  grafana-storage:
Run docker compose up -d and open http://localhost:3000 on the host.
The first login is admin/admin and Grafana makes you choose a new
password before anything else. Use the grafana/grafana image: it is the
open source edition, while grafana/grafana-enterprise is the upstream
default and grafana/grafana-oss stopped being updated with release
12.4.0. The volume keeps dashboards and users across container rebuilds;
back it up before major upgrades.
This needs Docker and the Compose plugin. On Ubuntu Server,
sudo apt install docker.io docker-compose-v2 installs both; on NixOS,
virtualisation.docker.enable = true; enables Docker.
NixOS
services.grafana = {
  enable = true;
  settings.server = {
    http_addr = "127.0.0.1";
    http_port = 3000;
  };
};
Run sudo nixos-rebuild switch, then visit http://127.0.0.1:3000 on the
host and change the initial admin password. The module keeps its data in
/var/lib/grafana; include that state in your backup plan.
Why it’s listed
Uptime Kuma tells you the moment something stops responding. Grafana shows the trend that led there, once you point it at the metrics your services already produce. The two cover different halves of watching a small setup.
Documentation
Docker Compose · Dashboards and alerts for metrics, logs and traces from your own data sources. Paste into your AI assistant. It may only be able to guide you. Review changes before running anything.
Researched, not run by the Index. Checked 2026-11-12. No AI account or connection is needed here.
Read or copy the prompt manually
NixOS · Dashboards and alerts for metrics, logs and traces from your own data sources. Paste into your AI assistant. It may only be able to guide you. Review changes before running anything.
Researched, not run by the Index. Checked 2026-11-12. No AI account or connection is needed here.
Read or copy the prompt manually
Tags: Monitoring
Want help running it? Ask FOSSadmin about hosting and maintenance ↗